Formatting Features
This page is a reference for the formatting features available when writing pages on this site. Each section shows the source syntax you write and the result it produces, so you can copy a pattern directly. The examples below are live: the citations open the reference panel, the callouts are styled, and the figure is rendered from executed code.
Citations
Citations are backed by a Zotero-managed bibliography. Every citation is clickable and opens a side panel showing the full reference, and optionally one or more supporting quotes.
The simplest form is a plain @key, which renders the author and year:
Large language models can stand in for survey respondents [@argyle2023].
Large language models can stand in for survey respondents (Argyle et al., 2023).
Several keys can be grouped in one set of brackets, separated by semicolons:
This idea has been examined from several angles [@argyle2023; @bisbee2024].
This idea has been examined from several angles (Argyle et al., 2023; Bisbee et al., 2024).
Attaching a supporting quote
To pull a quote from the source into the panel, use the cite shortcode. The first argument is the key; any string arguments after it are quotes:
!cite-shortcode!
The quote text shown in these examples is an illustrative placeholder, not a real excerpt. In practice you paste the actual passage. It renders as a normal citation: (Argyle et al., 2023). Click it to see the quote and reference.
A bare integer as the last argument is treated as a page number, and multiple quote strings are shown as a list:
!cite-shortcode!
(Brislin, 1970)
Grouped citations with per-citation quotes
When several citations share one parenthetical but each needs its own quote, use the cites shortcode. Each key is followed by an optional quote string; omit the string for keys that need no quote:
!cite-shortcode!
(Argyle et al., 2023; Bisbee et al., 2024)
Each author in the group is individually clickable, and the panel shows only that citation’s reference and quote. Use cites instead of the plain [@a; @b] form whenever any citation in the group needs a quote.
Callouts
Callouts highlight a piece of text in a labelled box. They use the GitHub alert syntax: a blockquote whose first line is [!TYPE]. Five types are available.
<div class="callout not-prose callout-note"><p class="callout-title">Note</p><p>Useful information the reader should notice.</p></div>
[!NOTE] Useful information the reader should notice.
[!TIP] A helpful suggestion or shortcut.
[!IMPORTANT] Something the reader must not miss.
[!WARNING] A caution about a likely mistake.
[!CAUTION] A risk with serious consequences.
Code
Fenced code blocks are syntax-highlighted by language. A block tagged r is shown but not run, which is the right choice when you want to display code without executing it:
```r
model <- lm(y ~ x, data = data)
summary(model)
```
model <- lm(y ~ x, data = data)
summary(model)
On pages authored in Quarto, a chunk written with {r} instead is executed, and its output is embedded below the code:
x <- rnorm(100, mean = 50, sd = 10)
summary(x)
   Min. 1st Qu.  Median    Mean 3rd Qu.    Max.
  34.23   44.13   50.97   51.09   56.49   74.52
Math
Mathematical notation is written in LaTeX and rendered with KaTeX. Inline math is wrapped in single dollar signs, so sits in the flow of the text.
Display math is wrapped in double dollar signs and is set on its own line:
$$
s^2 = \frac{1}{n-1}\sum_{i=1}^{n}(x_i - \bar{x})^2
$$
Figures and cross-references
A figure produced by an executed chunk can be given a label and a caption. Quarto numbers the figure and lets you refer to it from the prose.
Code
library(tidyverse)

tibble(x = 1:100, y = cumsum(rnorm(100))) |>
  ggplot(aes(x, y)) +
  geom_line() +
  theme_minimal()
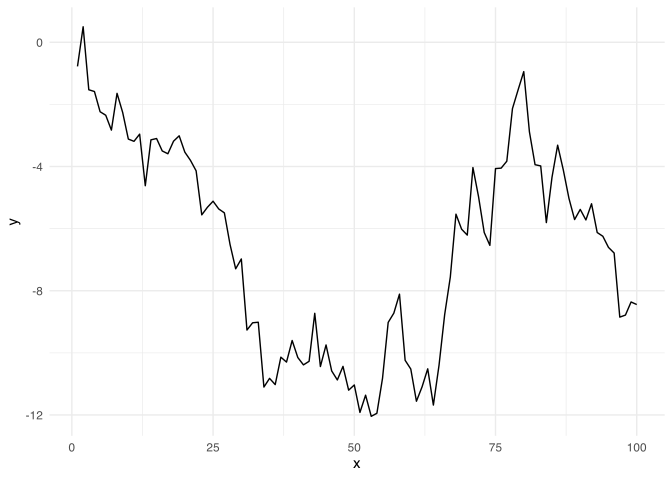
Figure 1: A figure rendered from executed R code.
Referencing the chunk’s label with @fig-demo produces a numbered link: Figure 1 shows the result. Figure and table cross-references work this way; section cross-references (@sec-) are a known limitation and do not navigate.
Tables
A data frame returned from an executed chunk is printed as a table:
tibble(
  measure = c("Mean", "SD", "Min", "Max"),
  value = c(mean(x), sd(x), min(x), max(x))
)
| measure | value |
|---|---|
| Mean | 51.089928 |
| SD | 8.754406 |
| Min | 34.229859 |
| Max | 74.522933 |
Markdown tables written by hand are also supported:
| Column A | Column B |
| -------- | -------- |
| Cell 1   | Cell 2   |
| Column A | Column B |
|---|---|
| Cell 1 | Cell 2 |
Frontmatter options
Each page begins with a YAML frontmatter block. The fields that affect rendering are:
---
title: "Page Title"
description: "One-line summary shown on the home page card."
toc: true # show the right-side table of contents
toc-depth: 2 # deepest heading level included in the TOC
order: 1 # position within its navigation group
---
Argyle, L. P., Busby, E. C., Fulda, N., Gubler, J. R., Rytting, C., & Wingate, D. (2023). Out of one, many: Using language models to simulate human samples. Political Analysis, 31(3), 337–355. https://doi.org/10.1017/pan.2023.2
Bisbee, J., Clinton, J., Dorff, C., Kenkel, B., & Larson, J. (2024). Synthetic replacements for human survey data? The perils of large language models. Political Analysis, 32(3), 401–416. https://doi.org/10.1017/pan.2023.27
Brislin, R. W. (1970). Back-Translation for Cross-Cultural Research. Journal of Cross-Cultural Psychology, 1(3), 185–216. https://doi.org/10.1177/135910457000100301