# Set the simulation parameters
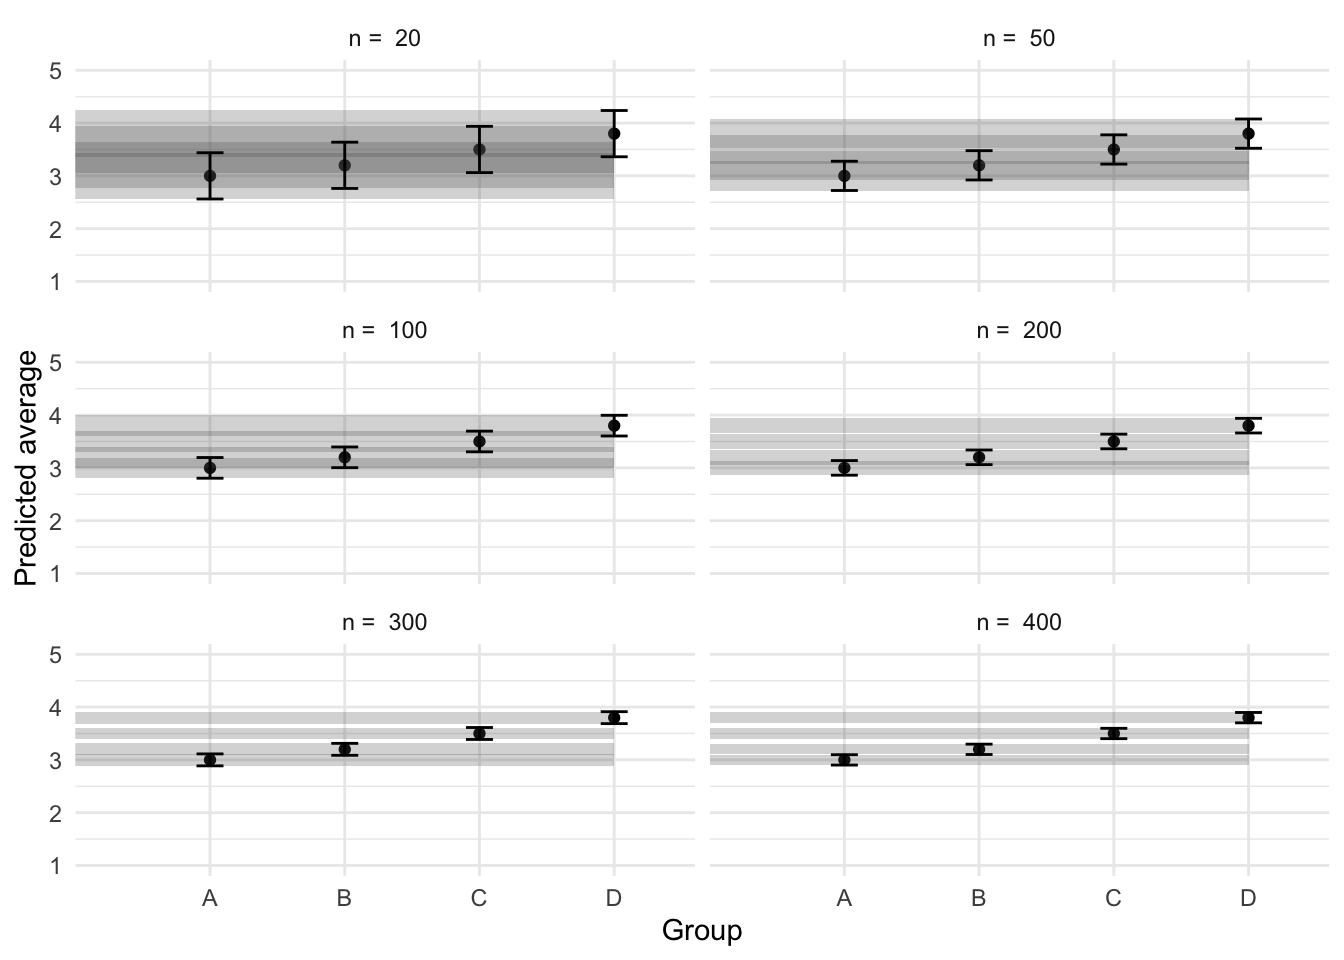
Ms <- c(3, 3.2, 3.5, 3.8)
SDs <- c(1, 1, 1, 1)
labels <- c("A", "B", "C", "D")
# Produce the variance-covariance matrix
Sigma <- matrix(
nrow = length(Ms),
ncol = length(Ms),
data = diag(SDs)
)
preds <- tibble()
Ns <- c(20, 50, 100, 200, 300, 400)
# Simulate
for (n in Ns) {
m <- mvrnorm(n = n, mu = Ms, Sigma = Sigma, empirical = TRUE)
colnames(m) <- labels
data <- m |>
as_tibble() |>
pivot_longer(
cols = everything(),
names_to = "predictor",
values_to = "response"
)
mod <- lm(response ~ predictor, data = data)
preds <- mod |>
avg_predictions(variables = "predictor") |>
as_tibble() |>
mutate(n = n) |>
bind_rows(preds)
temp1 <- avg_comparisons(mod)
}
ggplot(preds, aes(x = predictor, y = estimate)) +
geom_point(position = position_dodge(.9)) +
geom_rect(
aes(
ymin = conf.low, ymax = conf.high,
xmin = 0, xmax = 4,
group = predictor
),
alpha = .25
) +
geom_errorbar(
aes(ymin = conf.low, ymax = conf.high),
width = .2, position = position_dodge(.9)
) +
facet_wrap(
~n,
ncol = 2,
labeller = labeller(n = function(x) paste("n = ", x))
) +
labs(
x = "Group",
y = "Predicted average"
) +
scale_y_continuous(limits = c(1, 5), breaks = 1:5)